---
title: Navigating Dashboards in Trellis
description: Navigating Trellis Dashboardss
---
[Skip to content](https://support.gotrellis.com/en/knowledge-base/navigating-dashboards-in-trellis#main-content)
[](https://gotrellis.com/)
- [Home](https://gotrellis.com/)
Show submenu for Home
- [Advertising](https://gotrellis.com/advertising-ppc-automation/)
- [Dynamic Pricing](https://gotrellis.com/dynamic-pricing/)
- [AI-Content Optimization](https://gotrellis.com/product-content/)
- [Promotions](https://gotrellis.com/promotions/)
- [Pricing](https://gotrellis.com/pricing/)
- [Blog](https://gotrellis.com/blog/)
- [Contact](https://gotrellis.com/contact-us/)
Open main navigation
Close main navigation
- [Home](https://gotrellis.com/)
Show submenu for Home
- [Advertising](https://gotrellis.com/advertising-ppc-automation/)
- [Dynamic Pricing](https://gotrellis.com/dynamic-pricing/)
- [AI-Content Optimization](https://gotrellis.com/product-content/)
- [Promotions](https://gotrellis.com/promotions/)
- [Pricing](https://gotrellis.com/pricing/)
- [Blog](https://gotrellis.com/blog/)
- [Contact](https://gotrellis.com/contact-us/)
- [Log In](https://app.gotrellis.com/)
[Log In](https://app.gotrellis.com/)
How can we help you?
- There are no suggestions because the search field is empty.
1. [Trellis Knowledge Base](https://support.gotrellis.com/en/knowledge-base?hsLang=en)
2. [Getting Started](https://support.gotrellis.com/en/knowledge-base/getting-started?hsLang=en)
# Navigating Dashboards in Trellis
## Learn how to use Trellis dashboards to view, filter, and customize performance data across your account.
#### Overview
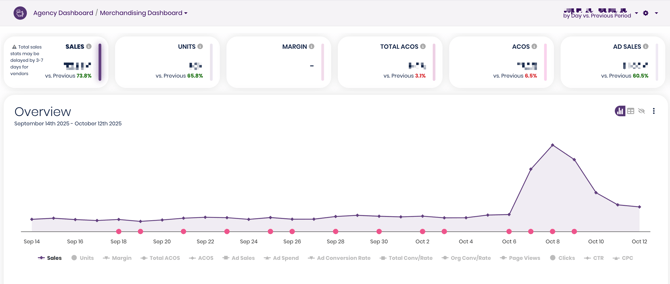
Dashboards in Trellis give you a complete view of your performance across Advertising, Pricing, and Content modules.
Each dashboard is interactive — allowing you to filter, customize, and drill down into the exact data you care about.
The example below shows the **Merchandising Dashboard**, which summarizes performance across all modules. You’ll see similar layouts within **Advertising**, **Pricing**, and **Categories** dashboards — each focused on its specific metrics.
**
---
### Video Walkthrough - Platform Tour & Navigation
### **🧭 How to Use the Dashboard**
### 1️⃣ Customize Summary Tiles
In the top-right corner of the dashboard, click the **three vertical dots (⋮)** to customize which summary metrics appear — such as **Sales**, **Units**, **ACOS**, or **Ad Spend.**
This allows you to tailor the top section of your dashboard to highlight the KPIs that matter most to your goals.
💡 *Example:* You might pin **ACOS** and **Ad Sales** if you’re focused on ad efficiency, or **Units** and **Margin** if you’re tracking product-level performance.
---
### 2️⃣ Adjust Table Metrics
Below the chart view, you’ll see the data table where performance is broken down by **Category**, **Product**, or **Campaign.**
Click the ⚙️ **gear icon** near the search bar to select which metrics you want to display in the table view.
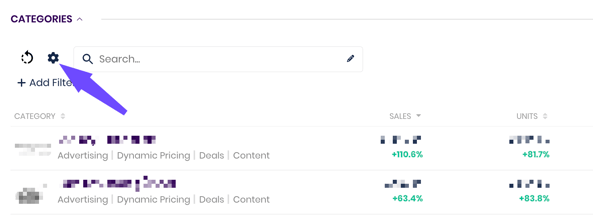
You can show or hide columns like:
- Sales, Units, and Margin
- Ad Spend and Cost
- CTR, CPC, or ROAS
This customization helps simplify your view — whether you’re analyzing advertising results or monitoring catalog-wide trends.
---
### 3️⃣ Filter and Search
Use the **Search Bar** or **Add Filter** option to narrow results. You can filter by:
- **Category** or **Tag**
- **Product** or **ASIN**
- **Ad Type** or **Media Plan**
- **Date Range**
💡 *Tags* are especially useful for creating cross-category views — such as filtering to see only *Seasonal Products* or *New Launches.*
---
### 4️⃣ Drill Down Into Modules
Each dashboard in Trellis can be viewed at multiple levels:
- **Merchandising Dashboard:** High-level overview of all modules combined.
- **Advertising Dashboard:** Metrics specific to campaigns and ACOS performance.
- **Pricing Dashboard:** Shows pricing changes, elasticity, and revenue impact.
- **Category Dashboards:** Focused on performance within a specific product category.
You can drill deeper from any summary view — click into a category or campaign to open its detailed dashboard.
---
### 5️⃣ Access Detailed Reports
For a full, line-by-line breakdown of your data:
Go to **Left Navigation → Reports → Product, Ad, or Target Reports.**
These reports show all SKUs, campaigns, or targets in list format — ideal for advanced analysis or exporting data to Excel.
### Video Walkthrough - Main Platform KPI's
---
#### 🧩 Tips
| Task | Tip |
| --- | --- |
| **Compare date ranges** | Use the top-right date picker to toggle between “vs. Previous Period” or “Custom Range.” |
| **View optimization impact** | You can filter on attributes like **NTM - Bid Managed** |
| **Cross-check by module** | The same filtering logic applies across Advertising, Pricing, and Content dashboards — use this to align performance views. |
---
Your dashboards update daily with synced data from Amazon. Product-level stats may show a 3–7 day delay depending on your vendor reporting schedule. If you are looking for real time reporting try using the **Today View** in the top right hand corner.
- [Getting Started](https://support.gotrellis.com/en/knowledge-base/getting-started?hsLang=en)
- [Advertising](https://support.gotrellis.com/en/knowledge-base/advertising?hsLang=en#main-content)
- [Media Plan Settings](https://support.gotrellis.com/en/knowledge-base/advertising?hsLang=en#media-plan-settings)
- [How To](https://support.gotrellis.com/en/knowledge-base/advertising?hsLang=en#how-to)
- [FAQs](https://support.gotrellis.com/en/knowledge-base/faqs?hsLang=en)
- [Dynamic Pricing](https://support.gotrellis.com/en/knowledge-base/dynamic-pricing?hsLang=en#main-content)
- [Pricing Strategies](https://support.gotrellis.com/en/knowledge-base/dynamic-pricing?hsLang=en#pricing-strategies)
[](https://gotrellis.com/)
[mailto:support@gotrellis.com](mailto:support@gotrellis.com)
Copyright © 2025, Trellis Corporation
```json
{
"@context" : "https://schema.org",
"@type" : "VideoObject",
"contentUrl" : "https://6658395.fs1.hubspotusercontent-na1.net/hubfs/6658395/video_assets/221587754908/inherited/web_optimized.mp4",
"dateModified" : "2026-09-10T13:59:29.622Z",
"duration" : "PT4M34S",
"height" : 1068,
"name" : "A1 Platform Tour & Navigation",
"thumbnailUrl" : "https://6658395.fs1.hubspotusercontent-na1.net/hubfs/6658395/A1%20Platform%20Tour%20&%20Navigation.mp4/medium.jpg",
"uploadDate" : "2026-09-10T13:59:29.620Z",
"width" : 1920
}
```
```json
{
"@context" : "https://schema.org",
"@type" : "VideoObject",
"contentUrl" : "https://6658395.fs1.hubspotusercontent-na1.net/hubfs/6658395/video_assets/221631601960/inherited/web_optimized.mp4",
"dateModified" : "2026-09-10T21:17:02.053Z",
"duration" : "PT4M51S",
"height" : 1080,
"name" : "A2 - Main Dashboard & KPIs",
"thumbnailUrl" : "https://6658395.fs1.hubspotusercontent-na1.net/hubfs/6658395/A2%20-%20Main%20Dashboard%20&%20KPIs.mp4/medium.jpg",
"uploadDate" : "2026-09-10T21:17:02.051Z",
"width" : 1618
}
```